Microsoft Power BI Training with AI
What you'll learn
- Build professional-quality business intelligence reports from the ground up
- Blend and transform raw data into beautiful interactive dashboards
- Explore powerful artificial intelligence tools and advanced visualization techniques
- Line charts, stacked bar charts, or geographic analyses using maps.
- Format numbers and dates, and add labels, tooltips and animation.
- Building and refine models, including adding calculated columns and measures.
- M and DAX functions, to enable you to build your own formulas.
- Explore Power Query and DAX functions to manipulate data effectively.
- Master the art of shaping and cleaning data to ensure it is ready for analysis.
- Leverage Power BI’s AI capabilities to uncover hidden patterns and trends in your data.
- Share your reports securely with colleagues and stakeholders and collaborate on projects in a team environment.
- Work on Live Projects
Our Training Process

Practical Session

Assignment

Projects

Resume Building

Interview Preparation

Be Job Ready

Practical Session

Assignment

Projects

Be Job Ready

Interview Preparation

Resume Building
Key Highlights
- Personalized career coach
- 90% Practical Training
- Certification
- 100% Job Assistance
- Study material
- Instant doubt solving
- Mock Interviews
- Case studies and Projects

28 Hrs
Training Duration

25000+
Students Trained

1000+
Hiring Companies

12.5 LPA
Highest Fresher Salary
Microsoft Power BI Training with AI
- Introduction to Power BI.
- Power BI Desktop, Service and Mobile.
- Understanding the Power BI workflow.
- Installing and configuring Power BI Desktop.
- Creating and saving Power BI reports.
- Understanding workspaces and dashboards.
- Connecting to Excel and CSV files.
- Connecting to SQL databases.
- Connecting to web data sources.
- Connecting to folders and multiple files.
- Import and DirectQuery modes.
- Managing data source credentials.
- Refreshing connected data.
- Power Query interface and workflow.
- Profiling and understanding imported data.
- Cleaning missing and incorrect data.
- Changing data types.
- Removing duplicates and errors.
- Splitting and merging columns.
- Applied steps and query management.
- Basic M language concepts.
- Merge queries and joins.
- Append queries.
- Pivot and unpivot columns.
- Group By transformations.
- Conditional and custom columns.
- Working with multiple files.
- Reusable transformation logic.
- Advanced data shaping techniques.
- Understanding Power BI data models.
- Fact and dimension tables.
- Star schema design.
- Creating table relationships.
- Cardinality and cross-filter direction.
- Active and inactive relationships.
- Managing date tables.
- Building scalable data models.
- Introduction to DAX.
- Calculated columns.
- Measures and calculated measures.
- Row context.
- Filter context.
- Understanding evaluation context.
- Basic DAX expressions.
- CALCULATE and CALCULATETABLE.
- FILTER function.
- ALL and REMOVEFILTERS.
- SUMX, AVERAGEX and other iterators.
- RELATED and RELATEDTABLE.
- IF, SWITCH and logical functions.
- Understanding filter context changes.
- Building business calculations with DAX.
- Working with date tables.
- Year-to-Date calculations.
- Month-to-Date calculations.
- Quarter-to-Date calculations.
- Year-over-Year analysis.
- Previous and parallel period calculations.
- Rolling period calculations.
- Period comparison techniques.
- Charts and graphs.
- Cards and KPI visuals.
- Tables and matrices.
- Slicers and filters.
- Formatting visual properties.
- Conditional formatting.
- Report themes and layouts.
- Designing business-friendly dashboards.
- Using AI to generate DAX formulas.
- Explaining DAX calculations with AI.
- Debugging DAX expressions.
- Generating Power Query transformations.
- Understanding M code with AI assistance.
- Improving and optimizing formulas.
- Using Copilot for Power BI workflows.
- Slicers and interactive filtering.
- Drill-down and drill-up.
- Drill-through pages.
- Bookmarks and report states.
- Page navigation.
- Buttons and interactive controls.
- Building guided report experiences.
- Advanced conditional formatting.
- Top N analysis.
- Map and geographic visuals.
- Decomposition Tree.
- Waterfall and funnel analysis.
- Custom visual selection.
- Advanced visual interactions.
- Building analytical report pages.
- Field parameters.
- Dynamic measures and visuals.
- Responsive report layouts.
- Page navigation and report structure.
- Dynamic titles and labels.
- Bookmarks for report interactions.
- Professional dashboard theming.
- Publishing reports to Power BI Service.
- Workspaces and workspace roles.
- Datasets and semantic models.
- Creating Power BI apps.
- Scheduled data refresh.
- Sharing reports and dashboards.
- Managing published content.
- Understanding Power BI security.
- Creating roles for Row-Level Security.
- Static and dynamic RLS.
- User and role-based access.
- Workspace permissions.
- Sharing and access control.
- Sensitivity labels and governance.
- Managing secure BI environments.
- AI-powered visuals in Power BI.
- Q&A visual and natural language queries.
- Key Influencers visual.
- Decomposition Tree for root-cause analysis.
- Smart Narrative.
- Copilot-assisted report creation.
- Generating insights with AI.
- Using AI for faster report development.
- Understanding Power BI Dataflows.
- Creating reusable data preparation pipelines.
- Dataflow transformations.
- On-premises data gateway.
- Gateway configuration and management.
- Scheduled refresh through gateways.
- Connecting cloud and on-premises data.
- Understanding Power BI performance.
- Optimizing data model size.
- Reducing unnecessary columns and rows.
- DAX performance optimization.
- Using DAX Studio.
- Analyzing query performance.
- Improving report loading speed.
- Power BI modelling best practices.
- Connecting Excel with Power BI.
- Analyzing Power BI semantic models in Excel.
- Using PivotTables with Power BI data.
- Creating PivotCharts from published models.
- Analyze in Excel functionality.
- Refreshing Power BI data in Excel.
- Combining Excel and Power BI workflows.
- Understanding real-world business requirements.
- Building a structured data model.
- Creating business-focused DAX measures.
- Designing interactive dashboards.
- Publishing portfolio-ready Power BI projects.
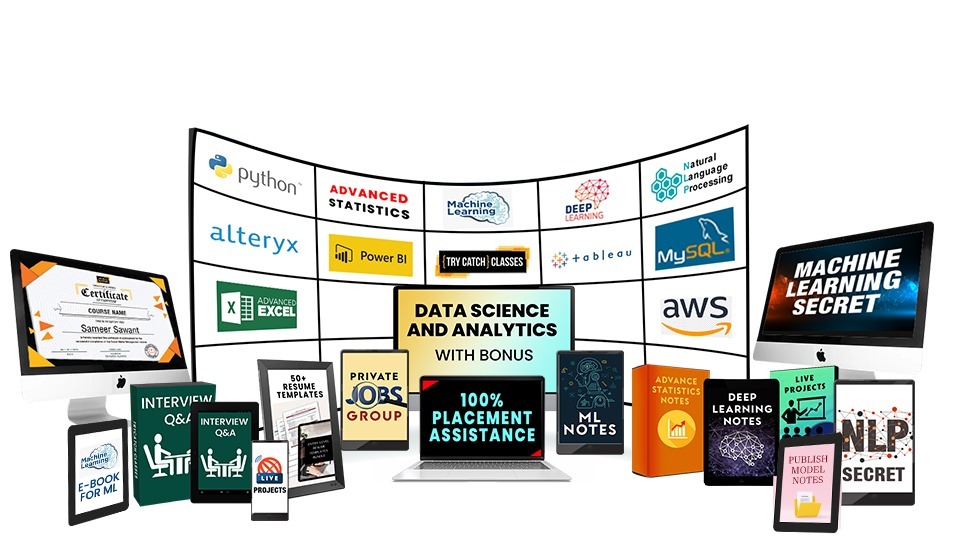
Master 35+ Paid tools, including AI Powered Platforms
Skills you will gain
Course Certification
This certificate serves as an official badge of your successful course completion, highlighting your expertise.
Students Testimonial
Students Reviews
dnone
Full Stack Developer
Company
Genuine reviews for our Microsoft Power BI Training with AI
Rasik Medha
Data Analyst
Posted on
Sumit Tiwari
Data Analyst
Posted on
Sanskriti Bhosale
Data Analyst
Posted on
Sanskriti Bhosale
Data Analyst
Posted on
Yash Mehta
Data Analyst
Posted on
Yash Mehta
Data Analyst
Posted on
Dinesh Singh
Data Analyst
Posted on
Kunal Jaisinghani
Data Analyst
Posted on
Software Developer
Posted on
Software Developer
Posted on
Software Developer
Posted on
Student's Portfolio
Success Stories
Frequently Asked Questions (FAQs)
What is the duration of the course?
Total duration of the PowerBI training course is approximately 1.5-2 months. Post completion of the training, you will work on several industry oriented Live projects too.
Are there any prerequisites before starting Microsoft Power BI Training?
No, previous coding experience is not required.
Who teaches Microsoft Power BI?
At TryCatch, our team consists of seasoned experts with over 15+ years of experience. A skilled Microsoft Power BI Developer will be guiding students, encouraging them to ask questions without hesitation, and enabling us to effortlessly address all your inquiries.
Is the course Online or Offline?
This Microsoft Power BI Stack course is available offline & online both. You may choose whatever is feasible for you.
Offline course can be done at our Borivali Branch in Mumbai.
Online Live Course can be done on Zoom or Google Meet.
Who can learn Microsoft Power BI?
This course is designed for everyone, even if you’re studying Commerce, Arts, or Mechanical subjects, or if you’re still in school. It doesn’t matter what your background is, you can definitely learn this course.
What software and tools do I need for this course?
All the tools required for this training will be installed during the course
Will I receive a certificate upon course completion?
Upon completion of the course, you will receive an official global Microsoft Power BI certificate. This certificate serves as an official badge of your successful course completion, highlighting your expertise.
Can I interact with instructors and ask questions during the course?
Absolutely! Our instructors are always available to answer all your questions and solve your doubts.
Are there any real-world projects or case studies in the course?
Yes, we incorporate real-world Live projects and case studies into the course to help you apply what you’ve learned in practical scenarios.
Is there 100% Placement Guarantee after the course is over?
We provide 100% placement assistance in Microsoft Power BI training course in Mumbai.
Is there a money-back guarantee if I’m not satisfied with the course?
We offer a satisfaction guarantee. If you are not satisfied with the course within a specified timeframe, you can request a refund.
Shoutout from Arjun Kapoor
and Vidya Balan
Here's everything you're going to get
- Easy-to-follow modules
- Study Materials
- Tutorials
- Interview Q&A Library
- Industry Oriented LIVE Projects
- Mock Interviews
- Access to Private Jobs Group
- Be Job Ready


