
Most dashboards look good.
That’s usually not the problem.
They have clean visuals, structured layouts, and all the right charts. But when someone actually tries to use them for decision-making, the experience feels slower than expected.
You still need to:
- interpret the numbers
- look for patterns
- figure out what changed
And that’s where things start to feel inefficient.
In 2026, this gap is being addressed not by redesigning dashboards, but by making them smarter.
With Power BI with AI features, dashboards are gradually shifting from being static displays to interactive systems that actually assist in understanding data.
It’s not a complete transformation. But it’s enough to change how analysts work day to day.
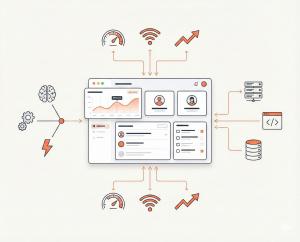
What AI Features in Power BI Actually Do
It’s easy to assume AI will automate everything. That’s not how it works here.
Instead, AI in Power BI supports the process.
It helps you:
- identify trends faster
- detect unusual patterns
- generate insights automatically
- interact with data using natural language
So instead of manually digging into data, you get a starting point.
And that starting point reduces a lot of repetitive effort.
Why This Matters More Now
Data isn’t the problem anymore.
Almost every business has data.
The real challenge is:
- extracting insights quickly
- making decisions without delay
Traditional dashboards slow this process down because they depend on manual interpretation.
AI-assisted dashboards reduce that dependency.
Which means:
- faster analysis
- quicker decisions
- less back-and-forth
For learners, this also changes expectations.
Knowing how to build dashboards is useful.
Knowing how to make them intelligent is what stands out.
Core AI Features in Power BI You Should Understand
Let’s focus on what actually gets used in real scenarios.
Natural Language Query (Ask Questions Instead of Building Charts)
Instead of creating visuals manually, you can type:
“Show revenue growth for last quarter”
And Power BI generates the visualization.
This reduces:
- manual effort
- dependency on technical queries
Key Influencers (Understanding What’s Driving Results)
This feature helps answer:
- why something happened
- what factors influenced an outcome
Instead of guessing patterns, you get structured explanations.
Smart Narratives (Turning Data into Explanation)
Instead of raw visuals, Power BI generates:
- summaries
- explanations
- insights in simple language
This is especially useful when presenting to non-technical stakeholders.

Anomaly Detection
Instead of manually spotting irregularities, AI flags:
- sudden spikes
- unexpected drops
This saves time and improves accuracy.
AutoML Integration (Advanced Use Case)
For more advanced scenarios, Power BI can:
- predict trends
- classify data
- generate forecasts
This brings machine learning closer to everyday analytics.
How to Build Smarter Dashboards (Practical Approach)
Using AI features alone doesn’t make dashboards better.
The approach needs to change.
Start with Questions, Not Visuals
Most dashboards start with charts.
Better dashboards start with:
- what decision needs to be made
- what insight is required
Use AI for Exploration
Instead of building everything manually:
- test ideas using AI
- explore patterns
- refine outputs
Combine Visuals with Context
Charts show data.
AI-generated insights explain it.
The combination improves clarity.
Avoid Overloading the Dashboard
More visuals ≠ better dashboard.
Focus on:
- relevance
- clarity
- usability
Real-World Use Cases of Power BI with AI
Understanding features is useful—but seeing where they apply makes things clearer.
Sales Performance Analysis
Businesses use AI dashboards to:
- identify high-performing products
- track growth trends
- forecast demand
This reduces manual reporting effort.
Customer Behavior Tracking
AI helps in:
- segmenting customers
- understanding behavior patterns
- predicting churn
This allows businesses to act earlier instead of reacting later.
Marketing Campaign Optimization
Marketing teams use AI dashboards to:
- measure campaign effectiveness
- compare performance across channels
- optimize budget allocation
Financial Forecasting
Organizations use AI to:
- predict revenue
- detect unusual expenses
- improve budgeting decisions
Where Learners Get an Advantage
For beginners, AI reduces the initial difficulty.
Instead of struggling with:
- complex formulas
- advanced queries
they can:
- explore data more easily
- understand patterns faster
This is why structured programs like Microsoft Power BI Training with AI focus on practical application rather than just theory.
How This Impacts Data Analytics Careers
The role of analysts is evolving.
Earlier, the focus was on:
- collecting data
- cleaning data
- visualizing data
Now, the focus is shifting toward:
- interpreting insights
- guiding decisions
- communicating findings
AI handles part of the groundwork.
Analysts focus on meaning.
Students who go through proper Data Analytics Training adapt faster because they understand both tools and real-world application.
Common Mistakes to Avoid
Overloading Dashboards
Too much data reduces clarity.
Blindly Trusting AI
AI helps—but it still needs validation.
Ignoring Context
Data without context can be misleading.
Using AI Without Strategy
AI works best when used intentionally.
Future of Power BI with AI
This is still evolving.
Over time:
- AI integration will deepen
- dashboards will become more interactive
- manual analysis will reduce
But interpretation will still depend on humans.
Conclusion
Power BI with AI features doesn’t replace analytics—it improves it.
Less manual work.
More meaningful insights.
Better decisions.
For learners, this creates an opportunity.
If you combine:
- data understanding
- tool expertise
- AI usage
you can build dashboards that are not just visually appealing—but genuinely useful.
Keep reading
Data Analytics & BIHow to Create Professional Business Dashboards Using Power BIHow to Create Professional Business Dashboards Using Power BI explains how to build interactive dashboards using Power BI, Power Query, DAX, and best practices for effective…Data Analytics & BICommon Data Visualization Mistakes and How to Avoid ThemData Analytics & BITop Business Intelligence Tools Every Data Professional Should Know← Previous article5 Full Stack AI Projects to Get Hired That You Can Build in 2026Next article →What Is Agentic AI? How Mumbai’s Data Scientists Are Building Autonomous AI Systems