
We’ve all been there. You’re staring blankly at your monitor, watching that little blue loading circle spin indefinitely. You just tried running a VLOOKUP across a few hundred thousand rows, and your laptop basically threw its hands up in defeat.
That was exactly the moment I knew my current setup wasn’t cutting it anymore.
If you’re just starting to dabble in the data world, you are likely wrestling with the exact same choice I did: Excel vs Power BI. It feels like a heavyweight title fight. Both tools are absolute giants in the corporate space, Microsoft owns both, and frankly, both are fantastic business intelligence tools. But let’s be real—you only have so much free time. Which one should you actually bother learning first?
Let’s ditch the formal definitions. Here is how this actually plays out when you’re trying to get your work done.

The Old Faithful vs. The Beast
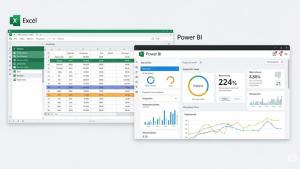
Before we really get into a Power BI vs Excel comparison, we need to understand their vibes. They do totally different things.
Think about Excel for data analysis. Excel is like your favorite pair of sweatpants. It’s comfortable, it’s always there, and you know exactly what to expect. It’s been living on our desktops for what feels like forever. You open a workbook, and bam—you have rows and columns begging for data. It shines when you have smaller, quicker tasks. Need to map out your team’s quarterly budget? Doing some quick and dirty financial modeling? Throwing together a pivot table to see which region sold the most units last month? Excel handles that ad-hoc stuff beautifully.
Power BI is a different animal entirely. If Excel is a reliable bicycle, Power BI is an 18-wheeler. It was literally designed to handle the kind of data volume that makes Excel lock up and crash before the file even fully opens. You don’t usually type data directly into Power BI. Instead, you point it at messy data sitting in your company’s CRM, website traffic logs, or huge SQL databases. It sucks all that chaos in and spits out a gorgeous, interactive Power BI dashboard. It’s less about doing math in a grid and way more about visual storytelling.
Where the Rubber Meets the Road
So, how do they actually stack up when your boss needs a report by Friday?
1. The Volume Problem
Excel maxes out at roughly a million rows. When you first hear that, it sounds like plenty. But trust me, in today’s data-obsessed world, it really isn’t. I’ve slammed into that row limit more times than I care to admit. And even if you don’t hit the limit, trying to run complex formulas on 500,000 rows means you’ll have enough time to go brew a fresh pot of coffee before it finishes calculating.
Power BI uses this insane compression engine behind the scenes. It can chew through tens of millions of rows effortlessly. If you’re dealing with sheer volume, Power BI takes the win without breaking a sweat.
2. Death by Manual Updates
Here is what drives me crazy about traditional spreadsheets: the endless manual repetition. Every Monday morning, you download the same CSV, paste it into your master file, delete the weird blank rows, and fix the date formatting because it inevitably broke again.
Power BI changes the game. You connect it to your data sources one time. Set it up once, and it just updates automatically in the background. Good BI reporting shouldn’t feel like manual labor. You finally get to stop acting like a “data janitor” and start actually figuring out what the numbers mean.
3. The “Wow” Factor
We have all sat through meetings looking at those standard, flat 3D pie charts from Excel. They get the point across, sure, but nobody is impressed by them anymore.
A dashboard built in Power BI is totally dynamic. If you click on a bar chart showing “Sales in California,” every single other graph on your page instantly filters to show only the California data. It makes you look like an absolute genius when you’re presenting to the executive team.
4. The Learning Curve Reality Check
I won’t sugarcoat this. Excel is cozy. Most of us have been clicking around in it since middle school. If you forget how to do a basic formula, a five-minute YouTube video usually sorts you out.
Deciding to learn Power BI takes some actual effort. You have to start thinking about “data modeling”—basically, how to get different tables of data to talk to each other without just relying on a VLOOKUP. Then there is DAX (Data Analysis Expressions), which is the formula language Power BI uses. It will definitely frustrate you in the beginning. But pushing through that initial confusion is entirely worth the payoff.
So, What’s the Move?
I hate generic advice, but your next step really depends on where your skills are at right now.
If you are a total beginner: Please, just start with Excel. Forget Power BI exists for a minute. You absolutely have to understand the fundamentals first—how filtering works, how pivot tables group information, basic logic. Excel builds that essential muscle memory. Once you feel solid with intermediate spreadsheet stuff, moving up to more complex data analytics tools feels natural instead of overwhelming.
If you know spreadsheets and want a bump in pay: Look closely at the jobs you want. If they demand intense financial modeling, get really good at advanced Excel. But if your goal is to be a Data Analyst, a BI Developer, or anything involving strategy? You need Power BI on your resume. Companies are desperate for people who can automate their messy reporting.
If your laptop sounds like an airplane taking off: If your current files are huge and constantly freezing your machine, just bite the bullet and learn Power BI. The hours you save next month will make up for the weekend you spent learning it.
The Bottom Line
These tools aren’t fighting each other; they’re coworkers. Most data professionals I know use both every single day. I still use Excel to quickly eyeball a messy dataset I just got, but I use Power BI to build the final, polished report for the higher-ups.
Think of them as steps on a ladder. Get comfortable with Excel. When you finally hit a wall because it’s too slow or the manual updates are driving you insane—that’s your sign. You are ready for Power BI.
If you are looking to fast-track your learning and want to avoid stumbling around on your own, I highly recommend looking into a structured Data Analytics Course In Mumbai if you value in-person classes, or finding a solid one online. Sometimes having a clear curriculum is exactly what you need. Or, if you want to dive deep into the real technical weeds, look for a comprehensive Data Science Training program; they usually cover both of these tools heavily, along with programming languages like Python.
Pick the tool that fixes your biggest headache today, and just start building.